As I mentioned to you previously, I’m sending you these 5-year charts for home sales, average sales price and home inventory for our Austin metro, 5-county region to help you graphically see what has been happening in our market. Here are my comments:
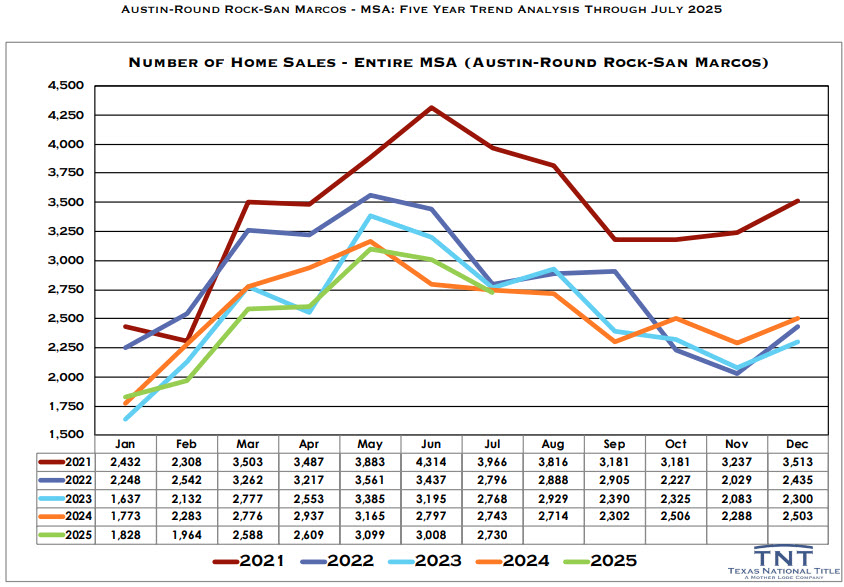
- For all 3 graphs, keep in mind that 2021 was the last and only full calendar year of our red-hot, record-setting 48 month-long market that was the result of Covid 19. It began in June, 2020 and ended in June, 2022. So, you can effectively remove 2021 and the 1st half of 2022 from the charts below and only compare those since to get a more reasonable idea of how 2025 is doing in comparison.
- Our July numbers for homes sold is right in line with the last 3.5 years, so things are settling back into a sense of a more normal market for us here;
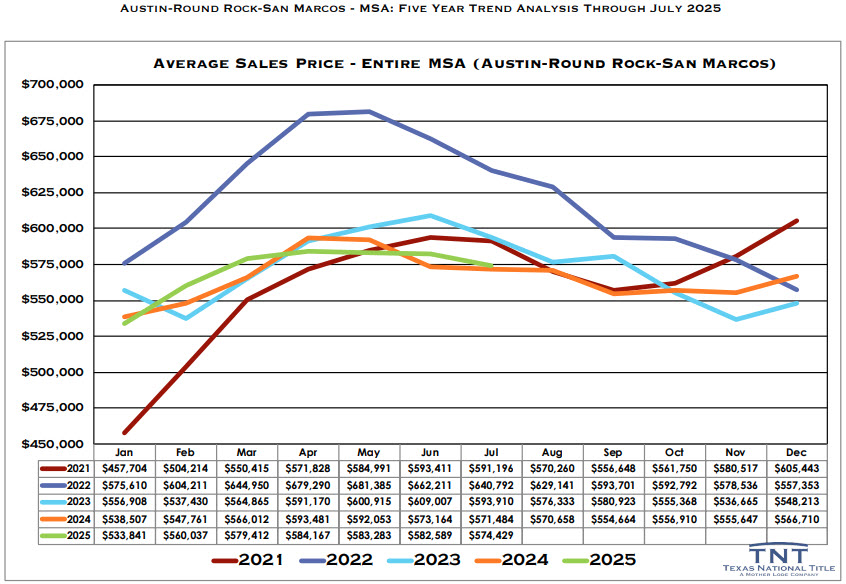
- Ditto for Average Home Sales price where we were spot-on during 2023, 2024 and 2025 which were within a few thousand of the $579,941 3-year average;
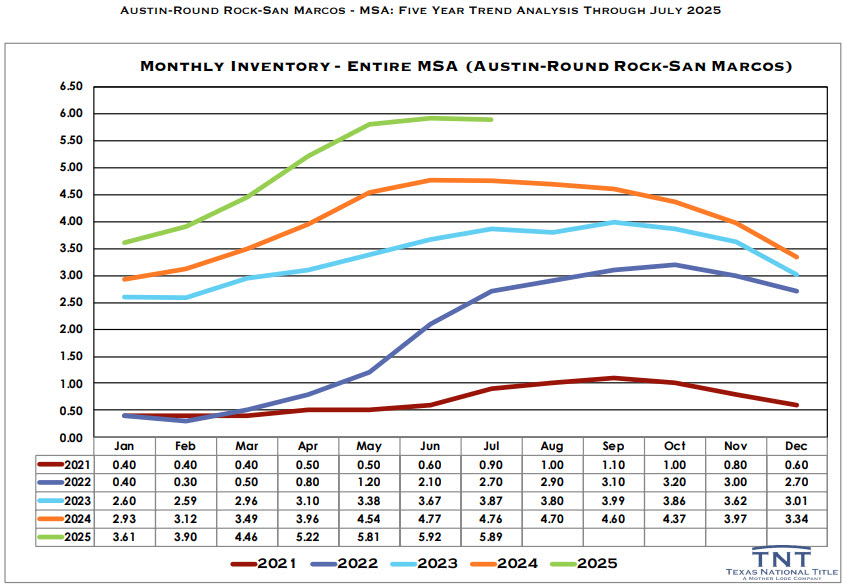
- Inventory is up this year, as it has steadily grown since the Fed drastically raised the prime interest rate beginning in Feb/2022 (see how inventory continued to uncharacteristically rise from July thru October in 2022). So, while our 5.92 (Jun) and 5.89 (Jul) months of inventory puts us in a buyer’s market, I believe once the Fed finally lowers interest rates this month (as projected), we will see mortgage rates drop and buyers purchasing existing inventory which will, in turn, lower our inventory numbers.
(512) 853-0110 or robert@AustinTxHomeSales.com