
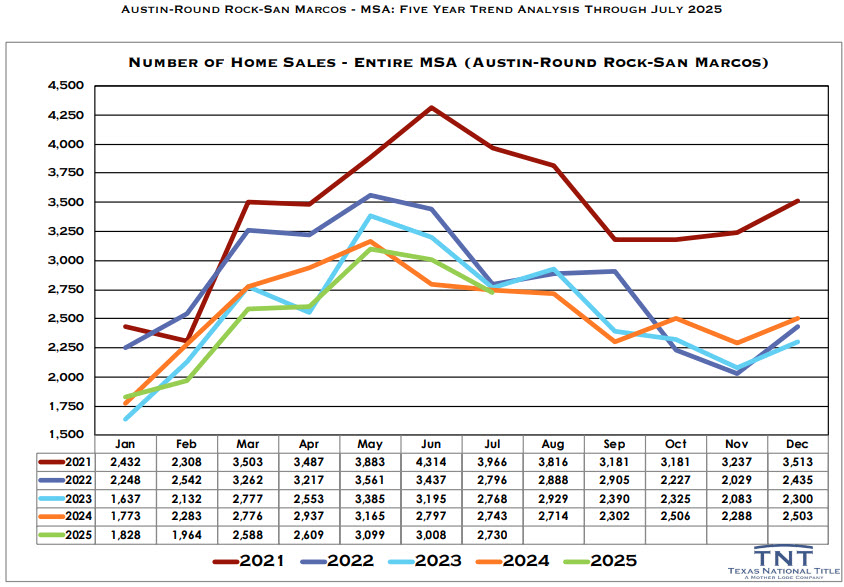
As I mentioned to you previously, I’m sending you these 5-year charts for home sales, average sales price and home inventory for our Austin metro, 5-county region to help you graphically see what has been happening in our market. Here are my comments: For all 3 graphs, keep in mind that 2021 was the last and only full calendar year of our red-hot, record-setting 48 month-long market that was...